When you have opened the dashboard and expanded the classifications you can display graphs for each classification. The main dashboard screen will show multiple graphs on screen at once. When you close and re-open, it will remember the last graphs viewed and display them immediately.
1.Open the Dashboard by clicking the icon on the top toolbar.
2.Expand the classifications and details by clicking the blue arrows ![]() (detailed in Displaying Data).
(detailed in Displaying Data).
3.Click the chart icon ![]() next to a classification to display a graph.
next to a classification to display a graph.
When 1 graph is displayed it fills the screen, but you can repeat and open multiple graphs, and they resize to fit to the screen.
4.Repeat this to show multiple graphs. They will automatically resize to fit the screen.
Customise Graphs
You can customise the appearance of each graph and then save them.
Click the chart icon at the top left of each graph to display the customise options:
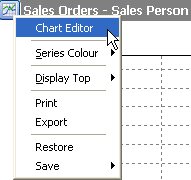
You can change the series colour and display the top number of results rather than all the data. To edit the chart labels and graph type click the Chart Editor. This opens all the available options, as you select each option the graph changes immediately.
Click Print to print the chart or click Export to save the chart as a graphic so it can be used in other applications or sent via e-mail.
Click Save to save the individual graph or all graphs in that group. When you re-open the graph the appearance will be remembered.
See also: