If you do not have access to the Dashboard module please contact EQ Support.
As with other areas of your business you can report on opportunities within Dashboard, showing the count, probability percentage, and weight (in £) for the following groupings:
Customer types, Sales person, Source of Lead, Showroom, Type, and additional classifications
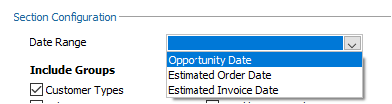
In Dashboard’s customise window you can decide which date the dashboard date uses (as shown below):
Opportunity date, Estimated order date, Estimated invoice date.
To open customise click the button at the top right showing the 2 ticks
Example Data in Dashboard
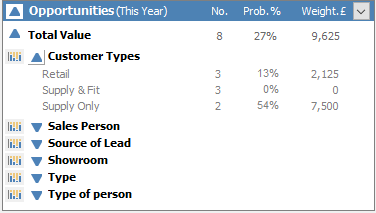
Double-click a grouping to see every opportunity within each. You can print or export the list to a spreadsheet.
Click the graph icon to begin building an easy to read chart. For more help see Dashboard in the online help.
If no classification has been completed for an opportunity, then it will default up the hierarchy to the customer. e.g. customer sales person will be used to classify it if the opportunity sales person is empty. Even when a status is set to "clear pipeline" it doesn't apply when displayed in dashboard.